
EcoMita Energy Consumption Management Measure, compare, analyse & reduce.
Helping you to understand your energy consumption and your carbon footprint, enabling a reduction in both. Electric, gas, diesel, LPG and water, side by side, on one dashboard.
Electric • Gas • Diesel • LPG • Water • CO2
Understand Your Energy Consumption & Carbon Footprint, In One Place

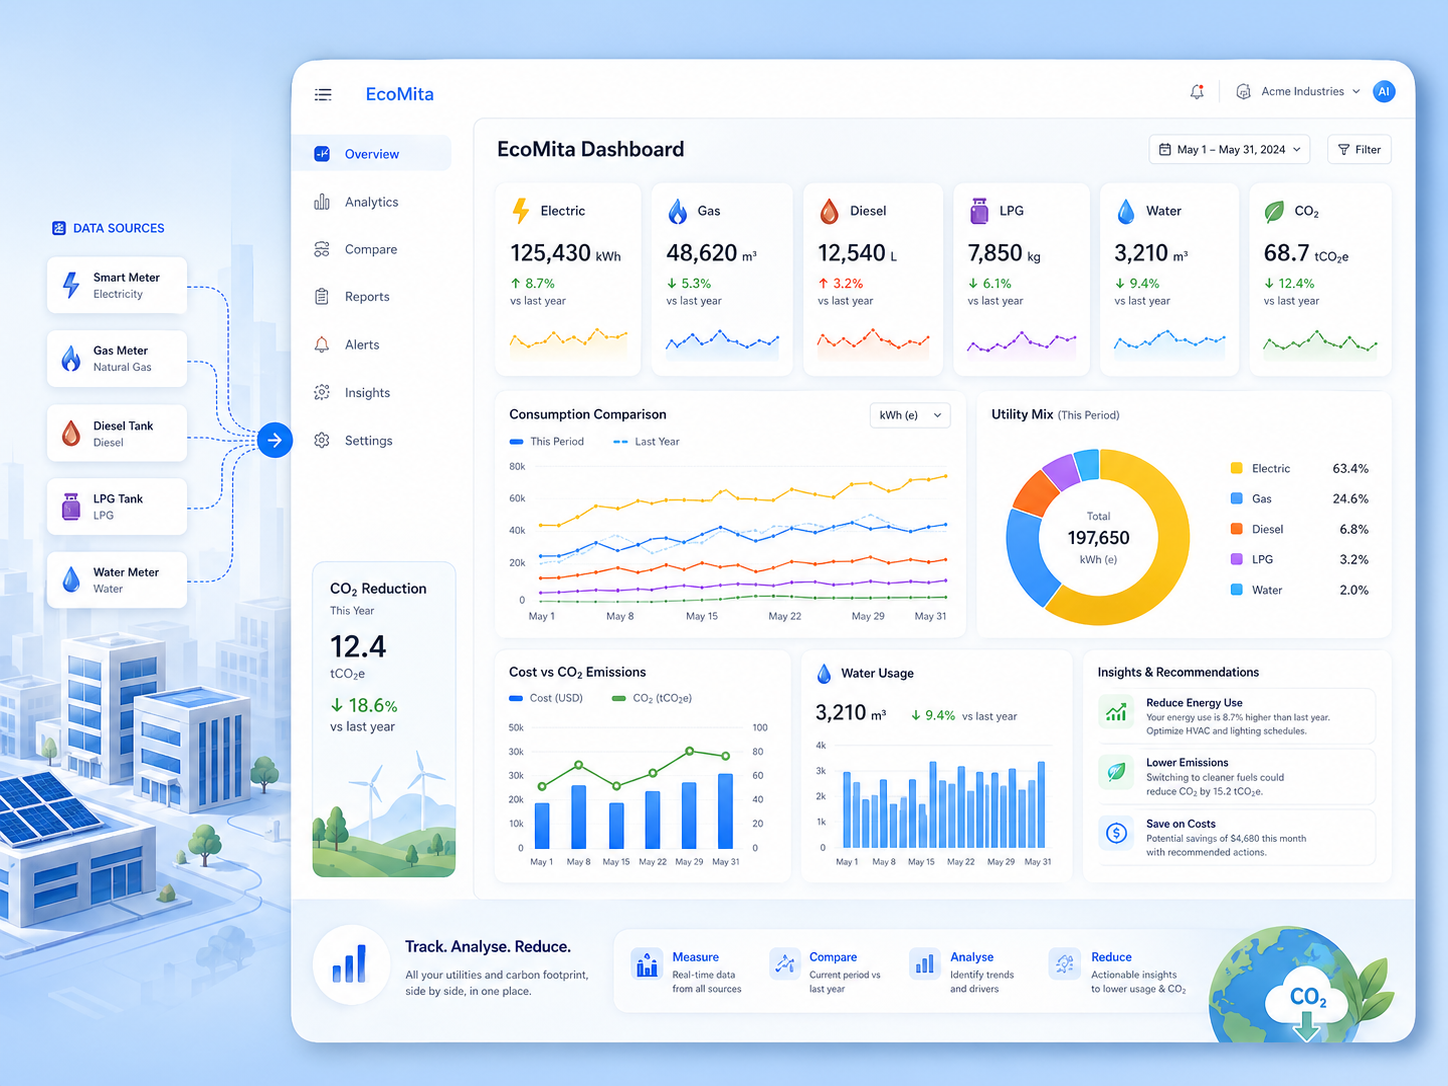
Consumption Dashboard & Reporting
- Electric, gas, LPG and diesel are displayed separately so each fuel can be examined in detail, not buried in a single energy total
- Month-to-date this year sits alongside month-to-date last year, so seasonal variance is obvious before it shows up on the bill
- Pie charts, trends and KPI tiles for every fuel, drillable by site, building, area and sub-meter
- Compares different fuels for both cost and CO2, the cheaper option and the cleaner option are not always the same
- Reports export cleanly for board packs, ESG submissions and sustainability reviews
From single sub-meter to whole estate, the same data, useful at every zoom level.
SCHEDULE A DEMO
Carbon Footprint, Calculated From the Real Generation Mix
- The electric generation mix is used for carbon footprint calculations, your CO2 reflects how the grid actually generated that power
- Actual CO2 amounts emitted shown in metric tonnes, with totals over time, not abstract intensity numbers
- Combines emissions from electric, gas, diesel and LPG into one footprint, so reductions in one fuel aren't undone by increases in another
- Trend lines highlight where the footprint is rising or falling, and which sites are driving the change
- Aligns with internal sustainability targets, investor reporting and external ESG frameworks
If you can't measure it accurately, you can't reduce it credibly , the carbon view starts with the real generation mix.
Watch How Carbon Footprint Is Calculated
Carbon Credits From Your Renewable Generation
- Renewable energy generation is shown as a carbon reduction in the dashboard, the offset is visible, not buried
- Helps you identify and seek carbon credits where they are available in your jurisdiction
- Solar, wind and other onsite generation can be tracked alongside grid imports for an honest net position
- The reduction picture is updated as readings come in, no spreadsheet reconciliation at year end
- Defensible audit trail of what was generated, what was consumed and what was offset
Turn renewable generation into a measurable, monetisable carbon position, not just a marketing line.
Request Your Demo Today
Water Usage & Financial Variance Against Budget
- Water usage is shown with comparisons against the same month in previous years, alongside energy
- Consumption and usage data compared like-for-like, this March vs last March, this Q2 vs last Q2
- Financials for each commodity are compared against budget, with variances flagged before they become surprises
- One view of cost and consumption, so the finance team and the operations team see the same numbers
- Drill from a budget variance into the underlying readings to find the cause, not just the symptom
Cost overruns and consumption spikes show up in the same place, with the same drilldown.
SEE BUDGET VARIANCE
IoT Smart Meters, Hourly Readings & AI Predictions
- IoT and smart devices can be supplied to read meters and send readings automatically, real-time, no clipboard rounds
- Meter readings can be collected hourly when needed, enabling much better analysis than monthly bills allow
- Manual readings stay supported, including a photo of the meter for sub-meters that aren't wired up
- Outside temperatures are factored in, so a cold January isn't mistaken for waste, and a warm July isn't mistaken for efficiency
- AI (coming later) will use the same data to predict future consumption and surface targeted mitigations where they pay back fastest
"Pearl Continental Hotel chain in South East Asia is using EcoMita to actively monitor energy and water usage whilst identifying opportunities to reduce their operating costs and carbon footprint."
Get EcoMita Demo Now
What's Inside EcoMita
Consumption Dashboard
Electric, gas, diesel and LPG shown separately with month-to-date and prior-year comparisons. Pie charts, trends and KPI tiles, drillable by site, building, area and sub-meter.
Carbon Footprint Tracking
Actual CO2 in metric tonnes, calculated from the real electric generation mix and combined with emissions from gas, diesel and LPG, so the footprint is honest, not approximated.
Carbon Credit Insights
Renewable generation surfaces as a carbon reduction in the dashboard, helping you identify and seek carbon credits where they are available in your jurisdiction.
IoT Smart Meter Readings
IoT and smart devices read meters and stream readings automatically in real-time. Hourly granularity available where deeper analysis is required.
Water Usage Comparisons
Water consumption tracked alongside energy, with the same period-over-period comparisons. One screen for utilities, not three.
Budget & Financial Variance
Financials for each commodity compared against budget, with variances flagged early. The same numbers for finance and operations, no reconciliation gap.
Energy Consumption Management for Every Type of Site
Already trusted by operators with serious utility budgets , including the Pearl Continental Hotel chain in South East Asia, monitoring energy and water across its properties with EcoMita.

Hotels & Hospitality
Track electric, gas, LPG, diesel and water across every property. Identify rooms, kitchens and plant rooms driving usage, and reduce operating costs without affecting guest experience.

Commercial & Offices
Multi-tenant offices, retail and business parks. See consumption per floor and per tenant, compare against budget, and report carbon footprint to landlords, occupiers and ESG frameworks.

Manufacturing & Industrial
Energy-intensive plant rooms, production lines and warehouses. Hourly readings, fuel-by-fuel breakdown and budget variance, so engineering and finance work from the same data.

Food Production & Cold Storage
High electric and refrigeration loads watched continuously. Spot a cold store drifting from its baseline before it costs both stock and CO2.

Healthcare Estates
24/7 sites with critical equipment, kitchens and plant rooms. Track every fuel and water use with carbon reporting that supports public-sector net zero commitments.

Schools & Universities
Multi-block campuses with kitchens, labs, plant rooms and student housing. One dashboard for the estates team, sub-meter detail per building, and carbon evidence for sustainability boards.
Try EcoMita Energy Consumption Management
Measure, Compare, Analyse & Reduce
Book a call with an expert
Frequently asked questions
For multi-site organisations, this means the head office can see consumption across different locations, buildings, areas and sub-meters. Each fuel or utility is shown separately, so electricity usage is not mixed together with gas, diesel, LPG or water.
This is useful for hotels, factories, offices, schools, healthcare estates and any business with more than one building or meter. Teams can compare usage, check trends and spot where costs or consumption are rising.
EcoMita also supports smart meter and IoT readings, so meter data can be collected automatically where devices are connected. Manual readings can still be entered where needed, including photo evidence.
The dashboard shows consumption trends, KPI tiles, fuel-by-fuel breakdowns and comparisons against previous periods. If electricity, gas, water or fuel usage starts to rise, teams can investigate the issue sooner.
For example, a site may be using more electricity because equipment has been left running, refrigeration is drifting from its normal pattern, heating is working harder than expected, or water usage has increased unexpectedly.
EcoMita helps teams move from “we found out too late” to “we saw the increase early and checked the cause.” That makes it much easier to reduce waste before it turns into a bigger cost problem.
Instead of asking each site to send separate meter readings or spreadsheets, EcoMita brings the data into one reporting view. Teams can compare one location against another and see which site is using more electricity, gas, diesel, LPG or water.
This helps management ask better questions, such as:
- “Why is Site A using more gas than Site B?”
- “Why has water usage increased in this building?”
- “Which area is driving the highest electricity cost?”
The system shows usage by fuel type, site, building, area and sub-meter. This means teams can quickly move from “our energy bill has gone up” to “this building, meter or area is causing the increase.”
EcoMita also compares financials for each commodity against budget. If electricity, gas, diesel, LPG or water is over budget, the variance can be flagged early and investigated through the underlying readings.
This is useful for finance teams and operations teams because both sides can work from the same data. Finance can see the cost impact, while facilities or engineering teams can investigate the physical cause.
EcoMita gives businesses a clear view of electricity, gas, diesel, LPG and water usage. It also shows comparisons against previous periods and budget, so teams can see whether costs are rising because of higher usage, unusual site behaviour or seasonal changes.
For example, EcoMita can help identify high-usage buildings, energy-heavy plant rooms, cold storage areas, production lines, kitchens or sites that are performing worse than others.
The key benefit is that businesses can act on real usage data instead of guessing. Once the biggest cost drivers are visible, teams can focus on the areas where savings are most likely.
This reduces common problems such as missed readings, typing mistakes, late submissions, unclear handwriting and inconsistent site reporting. Where smart devices are connected, readings can be sent into the system automatically, including hourly readings when deeper analysis is needed.
This gives businesses more regular and reliable data. Instead of waiting for someone to visit each meter and send in a spreadsheet, the readings can flow directly into EcoMita.
Manual readings can still be used where needed, especially for older meters or sub-meters that are not connected yet. The benefit is that businesses can improve automation gradually without losing visibility over existing meters.
This is important because many businesses do not have every meter connected to smart devices. Some meters may be old, hard to access, located in plant rooms, or used for sub-metering within buildings.
With EcoMita, smart and IoT-connected meters can send readings automatically. For meters that are not connected, users can enter readings manually through the app and include a photo of the meter. The transcript also highlights that meter data can include photo documentation, the reader’s name, date, time and location details.
This gives the business a more complete record, even during the move from manual readings to automated monitoring. It also makes the readings easier to check later if there is a billing or reporting question.
If a meter is only checked once a month, a fault or energy spike may go unnoticed for weeks. With more frequent readings, teams can see when consumption moves away from the normal pattern.
For example, a cold room may start using more electricity than usual, a pump may run longer than expected, heating may stay on outside working hours, or water usage may rise because of a leak.
EcoMita supports hourly readings where detailed analysis is needed. This gives facilities, engineering and sustainability teams a better chance of spotting problems early, checking the cause and reducing waste before it becomes expensive.
When readings are collected regularly, businesses can compare current usage against normal patterns, budgets and previous periods. This makes it easier to detect abnormal electricity, gas or water consumption before it becomes a bigger issue.
For example, if one building suddenly uses far more water than expected, or a site’s electricity usage rises sharply, the team can investigate quickly rather than waiting for the bill.
EcoMita’s dashboard, readings, comparisons and smart monitoring support this kind of early-warning approach. This is especially useful for multi-site organisations where the head office cannot manually check every meter, every day.
This is useful because energy consumption often changes with the season. A cold January, a warm July, higher occupancy, production changes or longer opening hours can all affect usage.
EcoMita shows current usage alongside previous periods so teams can compare like-for-like. For example, this March can be compared with last March, or this quarter can be compared with the same quarter last year.
This helps businesses avoid making poor decisions based on one isolated bill. Instead, they can see whether usage is genuinely increasing, whether it follows a seasonal pattern, or whether one site is performing worse than expected.
The system allows teams to compare current usage with previous months, previous years, budgets, sites, buildings and meters. It also factors in outside temperature, so a cold January is not wrongly treated as waste, and a warm July is not wrongly treated as better efficiency.
This matters because higher energy usage is not always caused by waste. It may be caused by colder weather, longer opening hours, higher production volume, more occupancy, or equipment running differently.
By comparing data properly, EcoMita helps businesses find the real reason behind the increase. That makes it easier to take the right action instead of blaming the wrong site, team or asset.
The system compares financials for each commodity against budget, including electricity, gas, diesel, LPG and water. If a site or utility type is over budget, the variance can be seen early and drilled into.
This avoids a common problem where finance sees the cost increase, but operations does not have enough detail to explain it. With EcoMita, both teams can look at the same usage data, meter readings and site-level breakdowns.
Finance can track budget performance. Operations can investigate the cause. Sustainability teams can also see the carbon impact. This creates a clearer link between consumption, cost and carbon footprint.
For electricity, EcoMita uses the electric generation mix to calculate carbon footprint, so the CO₂ figure reflects how power was actually generated. It then combines this with emissions from gas, diesel and LPG, giving businesses a clearer total footprint over time.
This is especially useful for Scope 1 and Scope 2 reporting. Scope 1 usually covers direct fuel use, such as gas, diesel or LPG used by the business. Scope 2 usually covers purchased electricity.
EcoMita shows actual CO₂ in metric tonnes, rather than leaving teams to work only from kWh figures or disconnected spreadsheets. This makes carbon reporting more practical and easier to explain internally.
Many businesses struggle with carbon reporting because the data is scattered across supplier bills, spreadsheets, emails, site reports and manual meter readings. This creates delays, missing data and inconsistent calculations.
EcoMita reduces that problem by collecting data by fuel type, site, building, area and sub-meter. It supports automated readings from IoT and smart devices, while still allowing manual readings with meter photos where needed.
The system then uses this consumption data to report CO₂ in metric tonnes over time. This gives businesses a stronger evidence base for ESG, sustainability reviews, investor reporting and internal carbon reduction plans.
The platform shows electricity, gas, diesel and LPG separately, then combines emissions into one carbon footprint. This is important because reducing one fuel does not always mean the total footprint has improved. For example, a business may reduce gas usage but increase diesel or electricity use elsewhere.
EcoMita shows actual CO₂ in metric tonnes and uses trend lines to highlight whether the footprint is rising or falling. It can also show which sites are driving the change.
This helps businesses track whether sustainability actions are really working, rather than relying on rough estimates or annual calculations done after the fact.
EcoMita gives businesses clear views of energy usage, water usage, cost variance and carbon footprint. Reports can be exported for board packs, ESG submissions and sustainability reviews.
This helps teams avoid last-minute reporting work where they have to chase sites, collect bills, clean spreadsheets and calculate emissions manually.
EcoMita also helps show trends over time, including whether consumption and CO₂ are rising or falling. This makes sustainability reporting more credible because it is based on actual usage data, not just broad claims or one-off estimates.
Instead of saying energy use has improved without evidence, businesses can show actual readings, fuel-by-fuel usage, carbon footprint trends and site-level changes over time.
This is useful for internal sustainability targets, ESG reporting, investor reporting and management reviews. It also helps avoid weak sustainability claims that cannot be backed up with reliable data.
EcoMita shows actual CO₂ in metric tonnes and tracks whether the footprint is increasing or decreasing. Renewable generation can also be shown as a carbon reduction in the dashboard, giving businesses a clearer view of both consumption and offset impact.
This matters because high carbon emissions are often linked to specific parts of the operation. In a hotel, it may be kitchens, plant rooms or rooms with heavy heating and cooling demand. In manufacturing, it may be production lines, warehouses or high-energy equipment. In cold storage, refrigeration can be a major driver.
EcoMita shows each fuel separately and combines emissions into one footprint. This allows teams to see which sites or areas are contributing most to carbon emissions.
Once the biggest drivers are visible, businesses can prioritise the actions that are most likely to reduce both cost and carbon.
Facilities teams can use the data to investigate equipment, buildings, meters and usage patterns. Finance teams can track budget variance and utility cost increases. Sustainability teams can monitor CO₂ emissions, carbon footprint trends and ESG reporting data.
Without a shared system, each team often works from different spreadsheets, bills or reports. This creates confusion and slows down decision-making.
EcoMita helps remove that gap by connecting meter readings, usage trends, cost variance and carbon reporting in one place. That means everyone can discuss the same numbers and agree on what needs to be fixed first.
The platform tracks electricity, gas, diesel, LPG and water usage side by side. It supports automatic readings from smart meters and IoT devices, while still allowing manual meter entries with photos where needed.
The transcript also highlights that EcoMita can capture meter photos, record the reader’s details, date, time and location, maintain a reading history, and export data to Excel or through APIs. This helps businesses keep a clearer audit trail and connect usage data with billing.
Instead of waiting until month-end to understand costs, EcoMita gives teams a clearer view of consumption, carbon footprint, budget variance and reduction opportunities as data comes in.